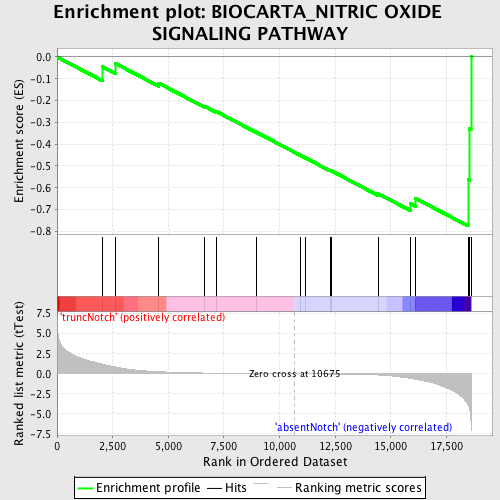
Profile of the Running ES Score & Positions of GeneSet Members on the Rank Ordered List
| Dataset | Set_03_absentNotch_versus_truncNotch.phenotype_absentNotch_versus_truncNotch.cls #truncNotch_versus_absentNotch |
| Phenotype | phenotype_absentNotch_versus_truncNotch.cls#truncNotch_versus_absentNotch |
| Upregulated in class | absentNotch |
| GeneSet | BIOCARTA_NITRIC OXIDE SIGNALING PATHWAY |
| Enrichment Score (ES) | -0.77526623 |
| Normalized Enrichment Score (NES) | -1.6007968 |
| Nominal p-value | 0.008316008 |
| FDR q-value | 0.24539915 |
| FWER p-Value | 0.919 |
| PROBE | DESCRIPTION (from dataset) | GENE SYMBOL | GENE_TITLE | RANK IN GENE LIST | RANK METRIC SCORE | RUNNING ES | CORE ENRICHMENT | |
|---|---|---|---|---|---|---|---|---|
| 1 | PPP3CC | 2450139 | 2039 | 1.176 | -0.0447 | No | ||
| 2 | PRKCA | 6400551 | 2627 | 0.839 | -0.0300 | No | ||
| 3 | NOS1 | 5860129 | 4570 | 0.258 | -0.1202 | No | ||
| 4 | GRIN2A | 6550538 | 6630 | 0.092 | -0.2259 | No | ||
| 5 | GRIN2C | 1500538 | 7161 | 0.073 | -0.2503 | No | ||
| 6 | CAMK2B | 2760041 | 8961 | 0.030 | -0.3454 | No | ||
| 7 | GRIN2D | 6620372 | 10950 | -0.005 | -0.4521 | No | ||
| 8 | PPP3CA | 4760332 6760092 | 11159 | -0.008 | -0.4628 | No | ||
| 9 | PRKAR1B | 6130411 | 12273 | -0.030 | -0.5209 | No | ||
| 10 | GRIN2B | 3800333 | 12313 | -0.032 | -0.5213 | No | ||
| 11 | GRIN1 | 3800014 7000609 | 14452 | -0.152 | -0.6278 | No | ||
| 12 | PRKAR2B | 3130593 5220577 | 15901 | -0.577 | -0.6738 | Yes | ||
| 13 | PRKAR2A | 2340136 | 16096 | -0.664 | -0.6476 | Yes | ||
| 14 | PRKAR1A | 3450369 | 18471 | -3.872 | -0.5616 | Yes | ||
| 15 | PPP3CB | 6020156 | 18527 | -4.258 | -0.3297 | Yes | ||
| 16 | PRKACB | 4210170 | 18607 | -6.062 | 0.0005 | Yes |

